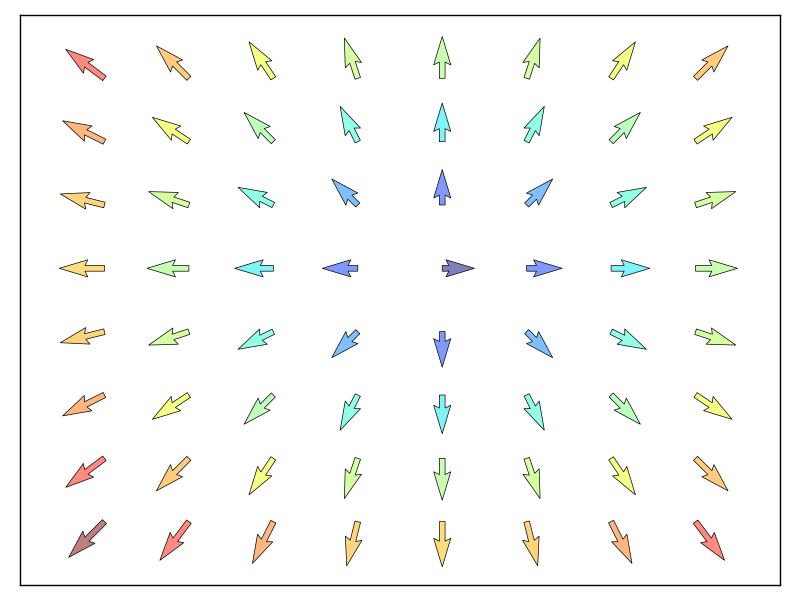
A simple example showing how to plot a vector field (quiver) with matplotlib.
Python source code: plot_quiver_ex.py
import numpy as np
import matplotlib.pyplot as plt

n = 8
X, Y = np.mgrid[0:n, 0:n]
T = np.arctan2(Y - n / 2., X - n/2.)
R = 10 + np.sqrt((Y - n / 2.0) ** 2 + (X - n / 2.0) ** 2)
U, V = R * np.cos(T), R * np.sin(T)

plt.axes([0.025, 0.025, 0.95, 0.95])
plt.quiver(X, Y, U, V, R, alpha=.5)
plt.quiver(X, Y, U, V, edgecolor='k', facecolor='None', linewidth=.5)

plt.xlim(-1, n)
plt.xticks(())
plt.ylim(-1, n)
plt.yticks(())

plt.show()
Total running time of the example: 0.03 seconds ( 0 minutes 0.03 seconds)
